


Every stream site owner hits the same wall eventually. The embed works, the schedule page ranks, the Twitch player loads fast on mobile, and yet the average session still collapses the second a series goes to a map break. Viewers do not leave because your video is bad. They leave because there is nothing on the page except video, and video pauses.
That gap is where odds boards and live data widgets have quietly become the most useful furniture on an esports page. They give a viewer a reason to stay during downtime, and they give you an inventory slot worth something to a partner. Editorial desks worked this out years ago. WIN.gg, where lead editor Ben Boland handles League of Legends patch notes and LCS odds coverage and writer Owen Harsono has covered Counter-Strike, Dota 2 and Valorant since 2021, runs its match reporting alongside standing coverage of licensed online esports wagering platforms and the numbers those markets publish. Its file on The International 2026 is the pattern in miniature: daily series reports sitting next to live market data, culminating in Team Spirit becoming the first organisation to lift the Aegis of Champions three times, in the grand final on 23 August 2026 in Shanghai. The lesson for a smaller site is not “become a tipster”. It is that live numbers hold attention between kills the way a scoreboard does.
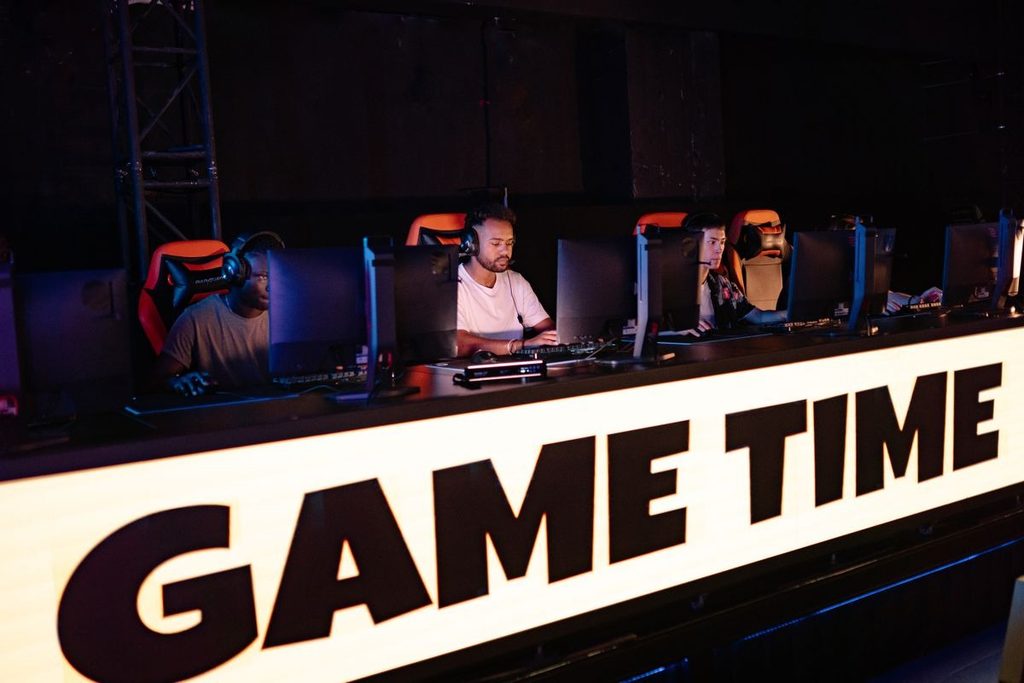
The audience is finally big enough to build against
The reason this works now is scale, though quote the scale carefully. Estimates of the 2026 global esports audience run from roughly 641 million to 676 million viewers depending on which firm you ask and how loosely each defines an occasional viewer. The lower end, about 641 million, comes from an April 2026 market report; the upper end circulates in secondary summaries with no clean primary publisher behind it. Both camps agree Asia-Pacific holds around 57% of the total, which is the number that should shape your scheduling and your ad clock.
Single events now clear numbers that used to describe whole seasons. The 2026 Esports World Cup reported 850 million total viewers and 440 million hours watched, peaking at 4.3 million concurrents on the League of Legends final.
The platform layer is flatter, and that matters more for a site owner than the headline audience does. Streamlabs and Hatchet counted 21.5 billion total hours watched across tracked platforms in Q2 2026, split roughly 21.0% to Twitch, 8.3% to YouTube Gaming and 6.3% to Kick. Twitch averaged 2.07 million concurrent viewers over the quarter, down 8.3% year on year. Read those together and the strategy writes itself: the audience is growing, the incumbent’s share of it is not, and viewers already watch the same match on whichever surface loads first. You are not competing with the platform player. You are competing with the second tab.
How large is the betting layer, actually?
Be sceptical of round numbers here, because published market sizes for esports betting vary by more than an order of magnitude depending on what the analyst counts.
| Source | 2025 figure | 2026 figure | What it implies |
|---|---|---|---|
| The Business Research Company (2026 report) | $12.59 billion | $14.17 billion | 12.5% CAGR on a broad market definition |
| Business Research Insights | $16.29 billion | $18.53 billion | roughly $4.36 billion above the TBRC figure for the same year |
| Global Growth Insights | $598 million | $712.22 million | a much narrower scope, counting a fraction of the same activity |
| Great Britain licensed operators, Jan–Mar 2026 | — | £3.90 million quarterly revenue | regulator-backed sample, +21.1% year over year |
The last row is worth pinning to your wall. As reported by Sportingpedia, operators licensed in Great Britain declared £3.90 million in esports betting revenue for the January to March 2026 quarter, a 21.1% year-over-year increase. For the denominator, the Gambling Commission’s operator sample for that quarter put total online yield at £1.55 billion, up 7% year on year. Esports is a rounding error inside that total, and it is growing three times faster than the total.
A demand-side reading agrees. Blask data covering 100 markets for the twelve months to June 2026 put esports at 0.7% of online betting demand, still enough to rank third among sports for unbranded search interest. Small share, disproportionate attention.
If you need one headline for a pitch deck, $14.17 billion for 2026 is the defensible pick, with the caveat that Business Research Insights places the same market at $18.53 billion because it draws the boundary differently. Quote both. A partner who sees you acknowledge the spread will trust the rest of your deck more than one who catches you picking the largest figure available.
The plumbing: who actually supplies the numbers
Nobody builds an odds widget from scratch, and you should not try. The live data behind these components comes from a short list of named suppliers, and knowing which one sits behind a feed tells you what your embed can and cannot display.
| Provider | Named product or role | What a stream page can surface |
|---|---|---|
| Stats Perform | Bet LiveStreams plus odds and data products for sportsbooks | synchronised low-latency video alongside live market data |
| Sportradar (Betradar) | sportsbook data, live odds, widgets and integrity monitoring across 50+ sports | live odds feeds and market movement |
| Genius Sports | official data, live odds and integrity products for media partners | officially sourced match data, embedded experiences |
| Feed vendors such as OddsAPI | raw odds feeds via API | lightweight custom widgets built in-house |
Two practical notes. First, rights matter more here than most people expect, because tournament organisers control the telemetry and sell it. Sportradar’s 2026 activity shows what that looks like: it retained Euroleague’s official data and audiovisual betting rights through 2031 and expanded its Polymarket partnership across more than 20 sports competitions. A feed backed by a rights deal is the difference between a widget you can sell against and one you hope nobody audits.
Second, no public 2026 research gives a clean revenue figure for the widget and creator-monetization segment on its own. That layer is platform-driven, spread across Twitch subscriptions and Bits, YouTube Gaming memberships and Super Chat, and TikTok sponsor integrations. Anyone quoting a precise market size for “betting widgets” is estimating.

Where the widget earns its place on the page
Placement beats novelty. A few patterns that hold up:
Put the data below the fold on desktop, above the comments on mobile. The player is why people arrived. Anything that pushes it down costs more than the widget returns.
Design for the delay. Segmented delivery, formalised in RFC 8216 back in 2017, means the video your viewer is watching trails the live server by seconds. A component polling in near real time will spoil the moment it is meant to enhance. Either throttle it to your player’s buffer or make the lag explicit in the interface.
Anchor it to a real event. A generic odds board is wallpaper. A board attached to a specific fixture is content. WIN.gg’s TI15 coverage was built around single series such as TEAM VISION against Team Falcons, which TEAM VISION took 2-1 on the back of a 94-minute deciding game. That is the unit of interest: one series, one page, one set of live numbers, and a decider long enough that a viewer will read whatever sits beside the stream.
Respect the calendar. The 2026 League of Legends World Championship runs 15 October to 14 November with 19 teams, staged across Los Angeles, Allen and Brooklyn. Going the other way, the Esports Foundation announced on 18 August 2026 that the inaugural Esports Nations Cup, drawing on more than 100 countries and territories, was postponed from November 2026 to November 2027. Widgets tied to dead events are worse than no widgets.
The compliance work nobody wants to do
Two documents will save you grief, and neither takes long.
Sponsored placements need disclosure a viewer actually sees. The Federal Trade Commission’s guidance for social media influencers is written for creators rather than lawyers, and its central requirement is simple: disclosures must be clear, conspicuous and hard to miss, not buried in a footer or hidden behind a “more” link. If a data component is there because of a commercial arrangement, say so next to it.
Accessibility is the other one. Odds tables are dense, colour-coded and frequently animated, which makes them among the easiest components to get wrong. WCAG 2.2 remains the current W3C Recommendation as of September 2026, its latest edition dated 12 December 2024, with WCAG 3.0 still circulating only as a Working Draft. It sets a 4.5:1 contrast minimum for normal text and requires that automatically updating content can be paused or stopped by the user. A live price board fails both by default unless you build for it.
A sane build order
Start with one tournament page, not a site-wide rollout. Add a static schedule and result block first, confirm it holds session time, then layer a single live component on top. Measure across a full event cycle, ideally one with a defined arc like The International 2026, which ran 13 to 23 August in Shanghai and gave editorial desks eleven consecutive days of fixtures to hang data against.
The economics only work if the numbers on your page are correct, current and clearly sourced. Get that right and the widget stops being decoration and starts being the reason someone stays through the map break.